In 2009, my collaborators and I published the Green View Index (GVI) as a quantitative indicator of urban forest greenery from the perspective of human visual perception. I am pleased to see that, over the past two decades, its role in quantifying the quality of urban greening has been widely recognized, and that it was the first to be adopted by the Beijing municipal government as an assessment indicator for urban ecological and environmental quality. However, many people are unclear about the origin of this index, and it is often traced back to the Japanese scholar Yoji Aoki. As the principal author of this index and its methodology, I used to simply brush off such claims with a smile whenever I encountered them in papers or academic presentations. But now that the index has become a government management tool, I feel I can no longer let this misconception spread and watch it acquire an inexplicable “Japanese lineage.” I am therefore writing this article to explain how the index actually came about.
In 2002, I served as the teaching assistant for the urban forestry course taught by my advisor, Professor Joe McBride, at the University of California, Berkeley, responsible for answering questions from students enrolled in the course. While we were studying the aesthetic benefits, instrumental benefits (such as mitigating the urban heat island effect and reducing air pollution), and symbolic benefits (culture and tradition) of urban forests, a student majoring in architecture raised a question: how can aesthetic benefits be quantified? To address this question, I conducted a literature review and found that, at the time, there was no satisfactory quantitative method. The mainstream approach was the Scenic Beauty Estimation (SBE) method, but this method was highly subjective, and what it ultimately produced was a rating score rather than a physical quantity with practical meaning.
In the process of trying to answer this question, two courses greatly inspired me. One was the remote sensing course taught by Professor Gong Peng, in which we systematically learned land cover classification using aerial photographs and satellite imagery. The classification results could provide an objective measure of urban green space area. Its limitation, however, was that remote sensing captures images from a top-down perspective, not the perspective of a person at eye level. The other course was silviculture, taught by Professor Kevin O’Hara, through which I learned about the Stand Visualization System (SVS). SVS is a software tool for visualizing forest stand structure that can generate three-dimensional views of stands. Combining this information, and building on the understanding—articulated in papers such as Ulrich (1985)—that seeing greenery produces various health benefits, I came up with an idea: to use the amount of greenery observed on vertical planes as an indicator for measuring the aesthetic benefits of urban forests, and to link this indicator with the amount of green space observed through remote sensing, thereby enhancing its interpretability and its applicability in urban forest management. Because the concept originated from the viewing perspective and involved measuring greenery, I named it “Green View.”
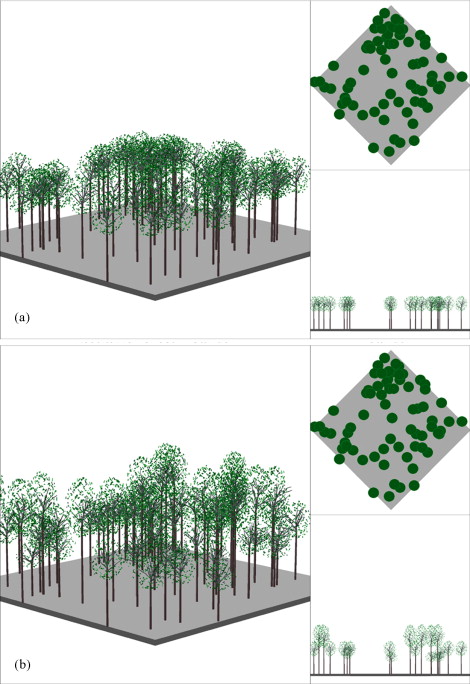
Figure 1. Two simulated tree stands. They look exactly the same from above but very different in vertical view
With the initial idea in place, I needed to determine a method for measuring greenery on vertical planes. I reviewed the literature of the time and found that internationally, photo interpretation was the main approach for quantifying vegetation structure on vertical planes. For example, Yoji Aoki and other Japanese scholars at the National Institute for Environmental Studies in Japan proposed using the proportion of greenery in photographs to analyze landscape perception (Aoki et al., 1985; Aoki, 1991, 1999). Schroeder and his colleagues used aerial photographs and ground-level photographs to quantify the visual impact of real estate development on landscapes (Schroeder, 1988), and directly linked the number of trees in the field of view to human perception (Schroeder, 1986). Synthesizing these previous studies, I decided to use a digital camera, with a fixed shooting height and aperture, to simulate the amount of urban forest greenery visible in the vertical direction within a person’s field of view. I discussed this idea with my advisor, who was very supportive and even purchased for this purpose the highest-resolution Canon digital camera available at the time. I chose the city of Berkeley for a pilot study, using the city’s intersections as the sampling population, and took photographs in four directions at dozens of selected intersections. I then experimented with various tools, including remote sensing software, to extract the greenery from the images, and ultimately found that manually extracting green pixels using Photoshop and then calculating the proportion of green in each image, though simple, was relatively efficient and accurate. Through the pilot study, I also calculated the variance of the Green View Index in Berkeley and used it to estimate the sample size needed to analyze the entire city.
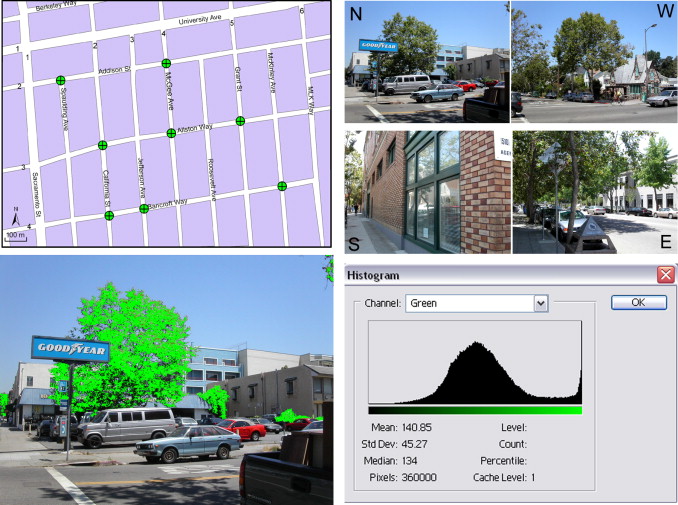
Figure 2. The process of estimating Green View Index
At this point, I must introduce another Chinese scholar who made an enormous contribution to the birth of the Green View Index. Professor Zhao Linsen of Southwest Forestry University was then a visiting scholar in my advisor’s lab. Although Professor Zhao’s specialty was forestry, he was very interested in urban forestry. He worked with me to complete the photography at 563 intersections in Berkeley, and in the later stage he played a leading role in processing and analyzing the 2,252 photographs. In addition to my advisor and Professor Zhao Linsen, Professor Gong Peng provided crucial assistance and guidance while I was analyzing high-resolution aerial imagery (National Agriculture Imagery Program, 1 m) and oblique multi-angle aerial imagery.
Our ground-level image collection and analysis work began in 2003 and was not completed until around the end of 2005. We then spent more than a year writing the first draft and engaging in thorough internal discussion and revision. In August 2007, I submitted the manuscript to Landscape and Urban Planning. However, the academic community at the time was extremely cautious about the introduction of a new concept; the three reviewers raised a large number of questions, and the manuscript went through four rounds of revision. We were very fortunate that the Editor-in-Chief, Professor Jon Rodiek (Texas A&M), recognized the value of our work and gave us the opportunity to revise. The paper was not accepted until the end of 2008 and was formally published in 2009. From the start of data collection to the final publication of the paper, we spent a full five years!
This was the first time the concept of the Green View Index was proposed, backed by a complete survey and analysis methodology. We explicitly pointed this out in the paper, and it was acknowledged by our peers: “Thus a new index called Green View is proposed in this paper to address this question: how visible is the urban forest to residents of a city? The index measures the amount of greenery that people can see on the ground at different locations in a city. The calculation for Green View combines statistical sampling with photograph interpretation. The goal of this study is to introduce the concept of Green View and explore the factors that can influence the values of Green View.”
We also explicitly stated in the paper the differences between the Green View Index and existing methods that used photographs to quantify landscapes, including the differences from the methods used by Yoji Aoki (1987, 1987–1988). Our index is an objective, statistically grounded quantification of the visible greenery of the entire urban forest, distinct from landscape analysis methods in other studies in which scenic spots were subjectively selected and the proportion of greenery in photographs was subjectively estimated. In Aoki’s research, for instance, 12 different scenic spots were selected, and respondents estimated the proportion of greenery in photographs (Aoki et al., 1985). In fact, Yoji Aoki never proposed the term “Green View Index”; in his papers, the English translations he used over the years were “amounts of green” (Aoki et al., 1985), “ratio of visual greenery” (Aoki, 1991), and “visual greenery ratio” (Aoki, 1987).
After the Green View Index was introduced, its development was also largely driven by Chinese scholars. For quite a long time, studies based on it remained small in scale and few in number, relying on ground-based surveys. This situation persisted until 2015, when Dr. Xiaojiang Li of the University of Connecticut, in collaboration with Professor Meng Qingyan of the Institute of Remote Sensing and Digital Earth at the Chinese Academy of Sciences, published a paper in Urban Forestry & Urban Greening that used Google Street View photographs to calculate the Green View Index for the Manhattan area of New York. Their advance resolved a limiting constraint in the application of the Green View Index—namely, substituting street view imagery for field image acquisition (Li et al., 2015). In 2017, Professor Long Ying of Tsinghua University published in PLOS ONE a methodology and results for calculating the Green View Index for 245 Chinese cities using Tencent Street View photographs. That study pioneered large-scale computation and cross-city comparison of the index, and quickly attracted attention from peers both in China and abroad (Long and Liu, 2017).
Following these groundbreaking works, the calculation methods and application scope of the Green View Index have continued to evolve—from quantifying streetscapes to quantifying greenery at any location within a city (Hua et al., 2025, 2026), from two-dimensional to three-dimensional measurement (Yu et al., 2016), and from single-time to multi-temporal assessment (Ma et al., 2025). Throughout this process, Chinese scholars have consistently been at the international forefront, leading the development of the Green View Index.
Building on the Green View Index, we also proposed in 2025 a new indicator, the Perceivable Green Volume (PGV), which advances the perception of urban green space greenery from simply measuring green volume to a comprehensive quantification that integrates psychological perception and vegetation structure, providing a new tool for enhancing urban residents’ sense of benefit from urban greening (Zhang et al., 2025). In fact, looking back at the Green View Index more than 20 years later, I find there is still so much that needs to be studied. Most of the questions we raised in the original paper remain poorly answered, so I warmly invite everyone to join in advancing research on the Green View Index and its practical applications.
Therefore, in the future, if you are using the Green View Index—with the aim of obtaining the visually perceived amount of greenery at scales from the block to the city level, using analysis methods based on statistical sampling or full-coverage digital imagery—please cite our paper or the papers by the Chinese authors listed below, and I would welcome you to state clearly in your presentations that this is an index developed by Chinese scholars. On the other hand, if you are conducting landscape perception analysis using the indicator known in Japanese as “緑視率,” translated into English as “visual greenery ratio,” with a methodology based on subjective comparative judgment, then please continue to trace it back to Mr. Yoji Aoki and other Japanese scholars. Please, by all means, do not conflate the two any longer!
References
Aoki, Y., Yasuoka, Y., Naito, M., 1985. Assessing the impression of street-side greenery. Landscape Research, 10: 9–13.
Aoki, Y., 1991. Evaluation methods for landscapes with greenery. Landscape Research, 16: 3–6.
Aoki, Y., 1999. Review article: trends in the study of the psychological evaluation of landscape. Landscape Research, 24: 85–94.
Hua, Y., Qian, Y., Wang, J., Liu Y., Zhou, W. 2026. Efficient green view index quantification from LiDAR point clouds. Landscape and Urban Planning, 271: 105614.
Hua, Y., Qian, Y., Fei, T., Chen, Z., Zhou, W. 2025. A new method for efficient green view index quantification using remote sensing. Urban Forestry & Urban Greening, 113: 129013.
Li, X., Zhang, G., Li, W., Ricard, R., Meng, Q., Zhang, W. 2015. Assessing street-level urban greenery using Google Street View and a modified green view index. Urban Forestry & Urban Greening, 14: 675-685.
Yu, S., Yu, B., Song, W., Wu, B., Zhou, J., Huang, Y., Wu, J., Zhao, F., Mao, W. 2016. View-based greenery: A three- dimensional assessment of city buildings’ green visibility using Floor Green View Index. Landscape and Urban Planning. 152: 13-26.
Long,Y., Liu, L. 2017. How green are the streets? An analysis for central areas of Chinese cities using Tencent Street View. PLoS ONE, 12: e0171110.
Ma, Y., Chen, P., Gong, M., Cai, Y., Jian, I. Y. 2025. The first seasonal Green view index mapping dataset across Chinese cities powered by deep learning. Scientific data, 12: 1356.
Schroeder, H. W. 1986. Estimating park tree densities to maximize landscape esthetics. Journal of Environmental Management. 23: 325-333.
Schroeder, H. W. 1988. Visual impact of hillside development: comparison of measurements derived from aerial and ground-level photographs. Landscape and Urban Planning. 15: 119-126.
Ulrich, R. S. 1984. View through a window may influence recovery from surgery. Science, 224: 420-421.
Yang, J., Zhao, L., McBride, J., Gong, P. 2009. Can you see green? Assessing the visibility of urban forests in cities. Landscape and Urban Planning, 91: 97-104.
Zhang, Y., Sun, Z., Ji, J., Li, X., Yang, J. 2025. Measuring perceived green volume for quantifying urban green exposure. Urban Forestry & Urban Greening, 116: 129231.
青木陽二, 1987. 都市景観の識別と評価に及ぼす緑の影響. 日本不動産学会誌, 2 (3): 68-74.
青木陽二, 1987-1988, 視野の広がりと緑量感の関連. 造園雑誌, 51(1): 1-10.